In AWS, for the EC2 instance, we won’t get memory metrics by default in CloudWatch. So one way to get this done is with the CloudWatch agent. By getting the memory metrics in AWS CloudWatch we can set up an Alarm to trigger notifications or any action. Below are the steps to create custom cloudwatch metrics
Step 1: Create an IAM role
As we use CloudWatch we need to authenticate to push metrics. If you are planning to implement this in an on-premise Ubuntu server, we can do this with IAM users, with programmatic access. As our instance is in EC2 we create an IAM role with the following steps.
Note : if you already have an IAM role attached to instance then just attach CloudWatchAgentServerPolicy policy to that role
Step 1.1:Sign in to the AWS Management Console and open the IAM console
Step 1.2:In the navigation pane of the IAM console, chooseRoles, and then choose toCreate role.
Step 1.3:For Select trusted entity, choose AWS service.
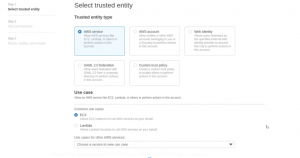
Step 1.4: Choose the use case as EC2. Then, choose Next.
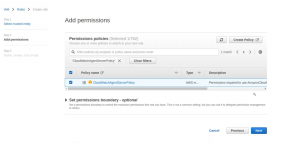
Step 1.5: In Permission policies search for CloudWatchAgentServerPolicy and select that, then click Next
Step 1.6: Give a name for the role created here we provide the name as EC2CloudWatchAgentRole. Below that we can review the things we created and, then click Create role
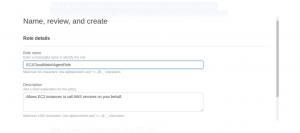
Now we have created our IAM role.
Step 2: Launch an EC2 with Ubuntu 20.04 ami
If you already have an EC2 launched you can skip this step. If you are doing this on an on-premise instance you can skip this step.
Step 2.1: Provide any name of the instance.
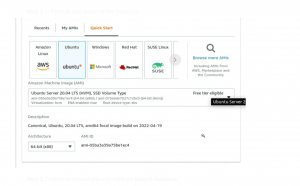
Step 2.2: Select Ubuntu Server 20.04 LTS AMI
Step 2.3: Choose t3a.micro or any instance type.
Step 2.4: Choose a key pair or create a new one if you don’t have access to existing key pairs.
Step 2.5: Keep Network settings default if you are new to VPC or customise as required
Step 2.6: Allocate more space if required. Suppose it’s for testing purposes 8GB is enough.
Step 2.7: Once reviewed you can click on launch instance.
Now we have created the instance.
Step 3: Attach the IAM role to the instance
Now we attach the IAM role created in Step 1
Step 3.1: Select instance click Actions then from Security select Modify IAM role

Step 3.2: Now from the drop-down you can select the role we created earlier
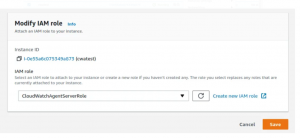
Select the role and click Save
Step 4: Let’s install and configure CloudWatch Agent
Let’s run this as root so we could avoid sudo in every command.
sudo su –
![]()
Step 4.1:Download the CloudWatch agent using the below command:

wget https://s3.amazonaws.com/amazoncloudwatch-agent/ubuntu/amd64/latest/amazon-cloudwatch-agent.deb
Step 4.2: Install the package:
To install the package use below command
dpkg -i -E ./amazon-cloudwatch-agent.deb
![]()
This will create a user cwagent, group with relevant permissions and installs the CloudWatch agent
Now lets packages with the below command
apt-get update
Step 4.3: Create the CloudWatch Agent Configuration File
We could do this in two ways:
1) Create this config.json file directly
2) Create the CloudWatch agent configuration file with the wizard
For automating purposes I would suggest the First option. If you choose the second option, the wizard would create the config.json for you, which also can be modified.
- Creating config.json file directly
Create a file named config.json in this path /opt/aws/amazon-cloudwatch-agent/bin/config.json and paste this JSON there
{
“agent”: {
“metrics_collection_interval”: 60,
“run_as_user”: “cwagent”
},
“metrics”: {
“aggregation_dimensions”: [
[
“InstanceId”
]
],
“metrics_collected”: {
“mem”: {
“measurement”: [
“mem_used_percent”
],
“metrics_collection_interval”: 60
}
}
}
}
NOTE : This policy is sending only memory metrics in every 60s. we have other intervals as 1s, 10s, 30s, and 60s. This metrics is fetched as cwagent
- Create the CloudWatch agent configuration file with the wizard
/opt/aws/amazon-cloudwatch-agent/bin/amazon-cloudwatch-agent-config-wizard
The questions and options are as follows
- On which OS are you planning to use the agent?
1. Linux
2. Windows
3. Darwin
default choice: [1]: - Trying to fetch the default region based on ec2 metadata…
Are you using EC2 or On-Premises hosts?
1. EC2
2. On-Premises
default choice: [1]: - Which user are you planning to run the agent?
1. root
2. cwagent
3. others
default choice: [1]: - Do you want to turn on StatsD daemon?
1. yes
2. no
default choice: [1]: - Do you want to monitor metrics from CollectD? WARNING: CollectD must be installed or the Agent will fail to start
1. yes
2. no
default choice: [1]: - Do you want to monitor any host metrics? e.g. CPU, memory, etc.
1. yes
2. no
default choice: [1]: - Do you want to monitor CPU metrics per core?
1. yes
2. no
default choice: [1]: - Do you want to add ec2 dimensions (ImageId, InstanceId, InstanceType, AutoScalingGroupName) into all of your metrics if the info is available?
1. yes
2. no
default choice: [1]: - Do you want to aggregate ec2 dimensions (InstanceId)?
1. yes
2. no
default choice: [1]: - Would you like to collect your metrics at high resolution (sub-minute resolution)? This enables sub-minute resolution for all metrics, but you can customize for specific metrics in the output JSON file.
1. 1s
2. 10s
3. 30s
4. 60s
default choice: [4]: - Which default metrics config do you want?
1. Basic
2. Standard
3. Advanced
4. None
default choice: [1]:
After answering this series of questions it will create a config.json at the same path as above.
Step 4.4: Check the status of the agent
To check the status of the CloudWatch agent.
/opt/aws/amazon-cloudwatch-agent/bin/amazon-cloudwatch-agent-ctl -m ec2 -a status
![]()
Step 4.5:To start the CloudWatch agent
use the below command to start the cloud watch agent.
/opt/aws/amazon-cloudwatch-agent/bin/amazon-cloudwatch-agent-ctl -a fetch-config -m ec2 -s -c file:/opt/aws/amazon-cloudwatch-agent/bin/config.json

You can check the status again to verify its running
![]()
Step 5: Let’s verify memory metrics are arriving in the CloudWatch console
Now to check in the AWS console, you can go to CloudWatch console, then metrics -> custom metrics -> host
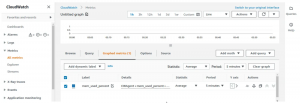
This is how a custom cloudwatch metric is created to monitor Ubuntu memory utilisation. Here i have used Ubuntu 20.04 but this should also work in other Debian-based OS. In case you don’t find metrics in the CloudWatch console double-check the role and its access.


Add comment